 severak
14.7.2020 14:30:10
severak
14.7.2020 14:30:10
I’m off camping this weekend, so you’re getting a short but important PSA.
If you’ve hung out on the internet for any length of time or in circles that talk about psych/cognitive biases a lot, you’ve likely heard of the Dunning-Kruger effect. Defined by Wiki as “a cognitive bias wherein persons of low ability suffer from illusory superiority, mistakenly assessing their cognitive ability as greater than it is.”, it’s often cited to explain why people who know very little about something get so confident in their ignorance.
Recently, I’ve seen a few references to it accompanied by a graph that looks like this (one example here):
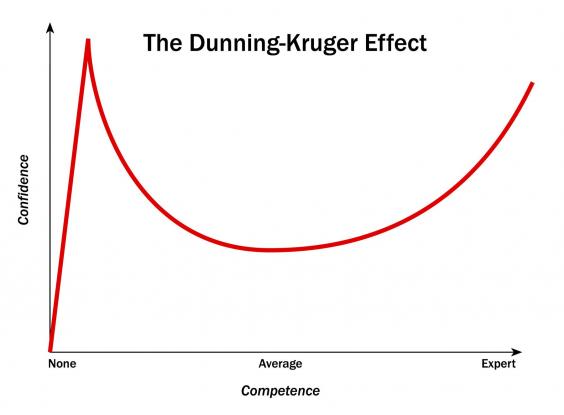
While that chart is rather funny, you should keep in mind it doesn’t really reflect the graphs Dunning and Kruger actually obtained in their study. There were 4 graphs in that study (each one from a slightly different version of the study) and they looked like this:
Humor:

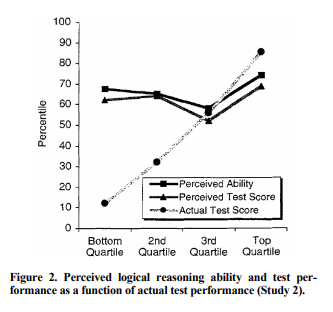
Logic and reasoning (first of two):
Grammar:

And one more logic and reasoning (performed under different conditions):
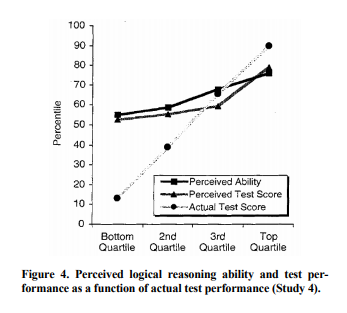
So based on the actual graphs, Dunning and Kruger did not find that the lowest quartile thought they did better than the highest quartile, they found that they just thought they were more average than they actually were. Additionally it appears the 3rd quartile (above average but not quite the top), is the group most likely to be clearsighted about their own performance.
Also, in terms of generalizability, it should be noted that the participants in this study were all Cornell undergrads being ranked against each other. Those bottom quartile kids for the grammar graph are almost certainly not bottom quartile in comparison to the general population, so their overconfidence likely has at least some basis. It’s a little like if I asked readers of this blog to rank their math skills against other readers of this blog….even the bottom of the pack is probably above average. When you’re in a self selected group like that, your ranking mistakes may be more due to a misjudging of those around you as opposed to just an overconfidence in yourself.
I don’t mean to suggest the phenomena isn’t real (follow up studies suggest it is), but it’s worth keeping in mind that the effect is more “subpar people thinking they’re middle of the pack” than “ignorant people thinking they’re experts”. For more interesting analysis, see here, and remember that graphs drawn in MS Paint rarely reflect actual published work.
The Real Dunning-Kruger Graph
from https://graphpaperdiaries.com/2017/08/20/the-real-dunning-kruger-graph/